

Read the first part here.
Analyzing the Various Approaches
I wanted to run an experiment that compared the three approaches of bass integration discussed in Part 1. No parametric equalization (EQ) was used; rather, I used the crossover settings, subwoofer phase, and volume adjustments, as well as added delay and polarity for the most sophisticated approach: #3. The best settings for each approach were compared.
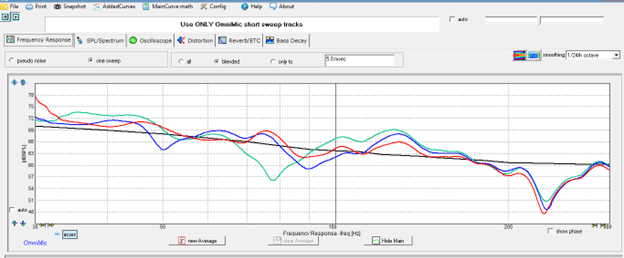
Below is a frequency response graph showing the best curve I could generate for each approach. Also shown is the desired target curve that is the goal for each curve to try to match. The chart’s X-axis represents a frequency range of 30 – 300Hz, the Y-axis represents the loudness in 3dB increments, while a 1/24th octave smoothing was used to show more granular results. Too much room gain below 30Hz made the measurements questionable and all three curves tracked identically above 300Hz.
BLACK line: my target curve: a 10dB slope from 25 to 200Hz
GREEN line: Approach 1: Mains High-Pass 80Hz @ 24dB slope, both subwoofers Low-Pass 80Hz @ 24dB slope
BLUE line: Approach 2: Mains High-Pass 140Hz @ 6dB slope, both subwoofers Low-Pass 100Hz @ 18dB slope
RED line: Approach 3: Mains High-Pass 67Hz @ 24dB slope, front subwoofer Low-Pass 74Hz @ 12dB slope and rear subwoofer Low-Pass 80Hz @ 12dB slope with a 3-millisecond delay and reversed polarity.
Bass and Math: Quantifying Each Curve’s Variance
To act as a second set of eyes for the curves, I called upon my data scientist friend who used three different mathematical methods called “Entropy,” “Correlation Coefficient,” and “Average Absolute Weighted Error” to calculate each curve’s variance from the target curve. Each method is a different approach on quantifying the error rate.
The variance comparisons:
| Entropy (smallest is best) | Correlation Coefficient (largest is best) | AAWE (smallest is best) | |
| Approach 1 | 0.014 | 0.835 | 0.046 |
| Approach 2 | 0.011 | 0.886 | 0.040 |
| Approach 3 | 0.008 | 0.955 | 0.034 |
The table supports the idea that the sample curves come closer to approximating the target curve when there’s more control flexibility for each speaker and subwoofer. For each math method above, Approach 3 scores closest to the target curve. This isn’t a big surprise because when “local” controls exist for every sound source you have, it provides the maximum flexibility to tailor the sound to your taste, which is what Approach 3 offers most over the other approaches. Global controls can work for left or right channels and/or for left-high or left-low frequencies (same with right), but their effectiveness and precision can only go so far.
Listening Notes
Approach 1 was my first foray into using subwoofers, so it was exciting and entertaining. I typically used too much volume due to the sub’s novelty factor and me wanting to hear what it could do. With too much bass, the response wasn’t well controlled and, since I didn’t use parametric EQ filters, could be boomy at certain frequencies. There was no digital way to time-align the subwoofers to each other and to the main speakers, so I used the phase control on the subwoofer’s plate amplifier to get the best response at the crossover point and below, as seen on the real-time frequency response charts. This, however, meant the bass from the subwoofer was delayed from that of the main speakers by one or more cycles, causing it to arrive a bit behind the beat of the music. This “slow bass” effect was unenjoyable to listen to.
Approach 2 drew me in with its less boomy, more articulate, and overall better bass. The added flexibility offered by this setup allowed for much experimentation, which was fun, and helped move the frequency response curve in the right direction. Despite having the same time alignment difficulties as in Approach 1, the smoother frequency response sounded very good.
Approach 3 allowed more of the leading transient attack of a note to be heard, such as from the thwack of a bass drum or the pluck of an upright bass. When a bass guitar was played very fast (e.g. by Brian Bromberg or Jaco Pastorious), it was easier to hear individual bass notes as separate sonic events than through the other approaches. This improvement was due to time alignment of the subwoofers to each other and to the main speakers. There was no boominess and all bass notes sounded equally loud and articulate. Compared to Approach 1, there seemed to be less bass (as Approach 1 was typically too present and boomy), which may suit an audiophile but not necessarily a bass-nut or lover of action movies. Approach 3’s bass bettered that of Approach 2 in smoothness, integration, and articulation.
To further improve the sound achieved by any of the three approaches, I suggest taking the following actions: 1) apply EQ to the bass region to better fit the actual frequency response to the target curve, 2) time align all subwoofers and speakers, and 3) reduce long bass decay times to bring them more in line with midrange decay times (e.g. average bass decay times are about 2X the average midrange decay times). These important steps in bass optimization are beyond the scope of this article.

Practical Tips and Interesting Findings
Through my bass-optimizing journey, a few things leapt out as interesting findings:
- The issue of overlap between the front subwoofer’s and the main speakers’ crossover frequency. Most of the articles I read suggest having an identical crossover frequency between the main speakers and subwoofers so there is a smooth transition between them. Maybe if different types of slopes were used, my results would have been different. To put things into perspective, the front subwoofer’s 74Hz and the main speakers’ 67Hz crossover points are only two semitones/notes apart, so they’re very close to each other. Any further overlap may muddy the high bass and low midrange.
- Placing subwoofers in ways that complement each other’s output curves. The front subwoofer had good output above 50Hz and little below it due to its room position away from boundaries. The rear subwoofer near a corner had very good low-end output (20-50Hz), which compensated for the front subwoofer’s weaker bass. Together, they did a very good job at approximating the target curve.
- Rooms are too unpredictable and require endless tinkering of subwoofer placement and settings. Relying only on one’s ears to find the ideal placement for a subwoofer, without the help of measurement software, is a bad strategy, in my opinion. Measurements are needed to note the effect of a change to the system or settings so you can determine if you’re moving in the right direction. Ears should be used for the final subjective testing.
- A curve that measures well may not actually sound great. This surprised me—I assumed that if curve A measures better than curve B, then A ought to sound better. I feel that phase artifacts introduced via parametric EQ filters are the culprit. At the end of the day, a target curve, and any desirable deviations from it, is very much a matter of personal taste. This is why I offer clients several target curves so they can find the one that sounds best to their ears.
Integrating one or more subwoofers into a stereo setup can be complex and time consuming. To aid in the setup, acoustic measurements are vital in extracting the best performance from a subwoofer, showing in real-time if a crossover frequency and slope, or a volume or phase change, has a positive or negative effect on sound quality. When the bass is time aligned with the main speakers, and the crossover frequencies have allowed you to reach your target curve, you will hear it. You will feel it. Your musical enjoyment and emotional satisfaction will escalate, and you may find yourself searching your music library for bass-heavy music so you can hear what you’ve been missing.
Read the conclusion here.


Leave a Reply